Using the browser console to troubleshoot errors
Most modern browsers come equipped with a built-in developer console which can be used to identify errors to assist with diagnosing technical issues with native web apps like Aiir's CMS.
🤔 What is the console?
The console shows critical errors and other important messages generated as web pages are loaded.
Normally, you would never need to open this, but if something isn't working as expected, the errors captured can be used to help Aiir's support team resolve the issue you are facing.
The errors and warnings produced in your browser may differ from what our team would see if they attempted to recreate the issue, so being able to access the logs from your browser is a vital step in resolving some technical issues.
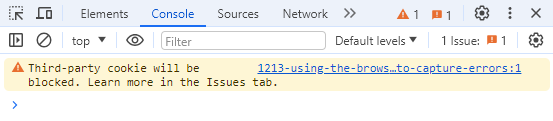
⌨️ Accessing the console
Follow these steps to access the developer console in your browser:
Press Ctrl + Shift + J on Windows or Linux, or ⌘ + Option + J on a Mac.
You can also open the menu in the upper-right corner of the window and select 'More Tools' then 'Developer Tools'.
Press Ctrl + Shift + I on Windows or Linux, or ⌘ + Option + J on a Mac.
You can also open the menu in the upper-right corner of the window and select 'More Tools' then 'Developer Tools'.
Press Ctrl + Shift + J on Windows or Linux, or ⌘ + Shift + J on a Mac.
You can also open the menu in the upper-right corner of the window and select 'More Tools' then 'Browser Console'.
Press ⌘ + Option + C to open the console.
You can also open the browser console from the 'Develop' menu, if enabled.
Open Safari preferences from the menu, go to the 'Advanced' tab and tick 'Show Develop menu in menu bar'. Once enabled, click 'Show Javascript Console' from the Develop menu.
✉️ Sending details to Aiir
If you see errors in your browser console, you can export a HAR file from your browser and send it to Aiir Support to help our team investigate and fix performance issues or bugs.
Here's how to create a HAR file, depending on your browser:
- Open Developer Tools from the View menu > Developer > Developer Tools (or press Cmd + Option + I on Mac, Ctrl + Shift + I on Windows).
- Click the Network tab in the Developer Tools pane.
- Check Preserve Log.
- Refresh the page and reproduce the issue.
- Click the download icon ↓ at the top left of the Developer Tools pane to save the log and send it to our team.
- Press F12 to open DevTools, or go to More tools > Developer tools from the toolbar menu. If the Network tab isn't visible, click the More tools (+) button and select Network.
- From the Network tab, select Preserve log.
- Reproduce the issue.
- Click the 🟥 Stop recording network log button.
- Click ↓ Export HAR (sanitized)... and save the file.
- From the Tools menu, go to Browser Tools > Web Developer Tools.
- Select the Network tab from the Web Developer Tools pane.
- Click the gear icon (⚙) at the top right and select Persist Logs.
- Refresh the page and reproduce the issue.
- Click the gear icon (⚙) at the top right again and select Save All as HAR.
- Enable the Develop menu by going to Safari menu > Settings > Advanced and checking Show features for web developers.
- Open the Web Inspector by going to the Develop menu and selecting Show Web Inspector (or press
Cmd + Option + I). - Click the Network tab.
- Click the Settings gear icon (⚙) in the Network tab and uncheck Clear when page navigates so your logs persist across page loads.
- Click the Clear Network items button in the top-right of the Network tab (or press
Cmd + K) to clear any existing entries. - Refresh the page and reproduce the issue.
- Click the export icon (an upward arrow/share icon) in the top-left corner of the Network tab's content pane to save the
.harfile to your computer.